Showing posts with label menus. Show all posts

Monday, January 16, 2023

Retro Review: Hewlett Packard HP 14B 50th Anniversary Edition

Retro Review:  Hewlett Packard HP 14B 50th Anniversary Edition


Quick Facts


Model:  HP 14B 50th Anniversary Edition 

Company:  Hewlett Packard

Years:  1989 (and probably 1990)

Type:  Finance

Batteries: 3 x LR44, SR44, AR76

Display:  1 line, alpha-numeric, 12 characters

Original Price:  $50, originally available only to Hewlett Packard's shareholders and employees 

Operating System:  Chain 


Features


*  Time Value of Money with Amortization.  Like all the HP financial calculators, the compute key is not used to calculate values.   The interest register is based on annual interest, while payments per year (P/YR) is a setting.  Beginning and ending of period payment modes are present.  


*  Cash Flows:  NPV and IRR.  These worksheets store the cash flow and make use the COMPUTE function to calculate NPV and IRR.  NPV is stored in PV while IRR is stored in I%YR.  


*  Solvers:  Cost/Price/Margin, Old/New/% Change, Nominal Rate vs. Effective 

Rate, Total/Part/% of the Total


*  Schedules:  ROI% (return on investment), Breakeven, and Inventory with Turnover analysis.   The schedules will make use of the down arrow key [ ↓ ], up arrow [ shift ] ( ↑ ), and the COMPUTE function [ shift ] (COMPUTE).  


*  Statistics:  One variable and two-variable.  Regressions included are:  


Linear:  y = m * x + b

Exponential:  y = b * e^(m * x)

Logarithmic:  y = b + m * ln x

Power:  y = b * x^m


There is also a Best fit mode, which decides the regression model based on the best correlation between the four modes.   


There are also two prediction sets  Going through the STAT menu, you can predict x and y values based on the chosen model.  Going through the FRCST (forecast) menu, the regression used is determined by the regression with the best correlation.


The Math menu contains three functions:  e^x, ln, and n!  (factorials for positive integers only).  


The 14B operates in chain mode, meaning no order of operations is followed.  The 14B operates similar to a four-function calculator in this regard.  


I think the 14B is set to be an intermediate finance calculator between the 10B and the 17B, which the 17B allows for user equations.  

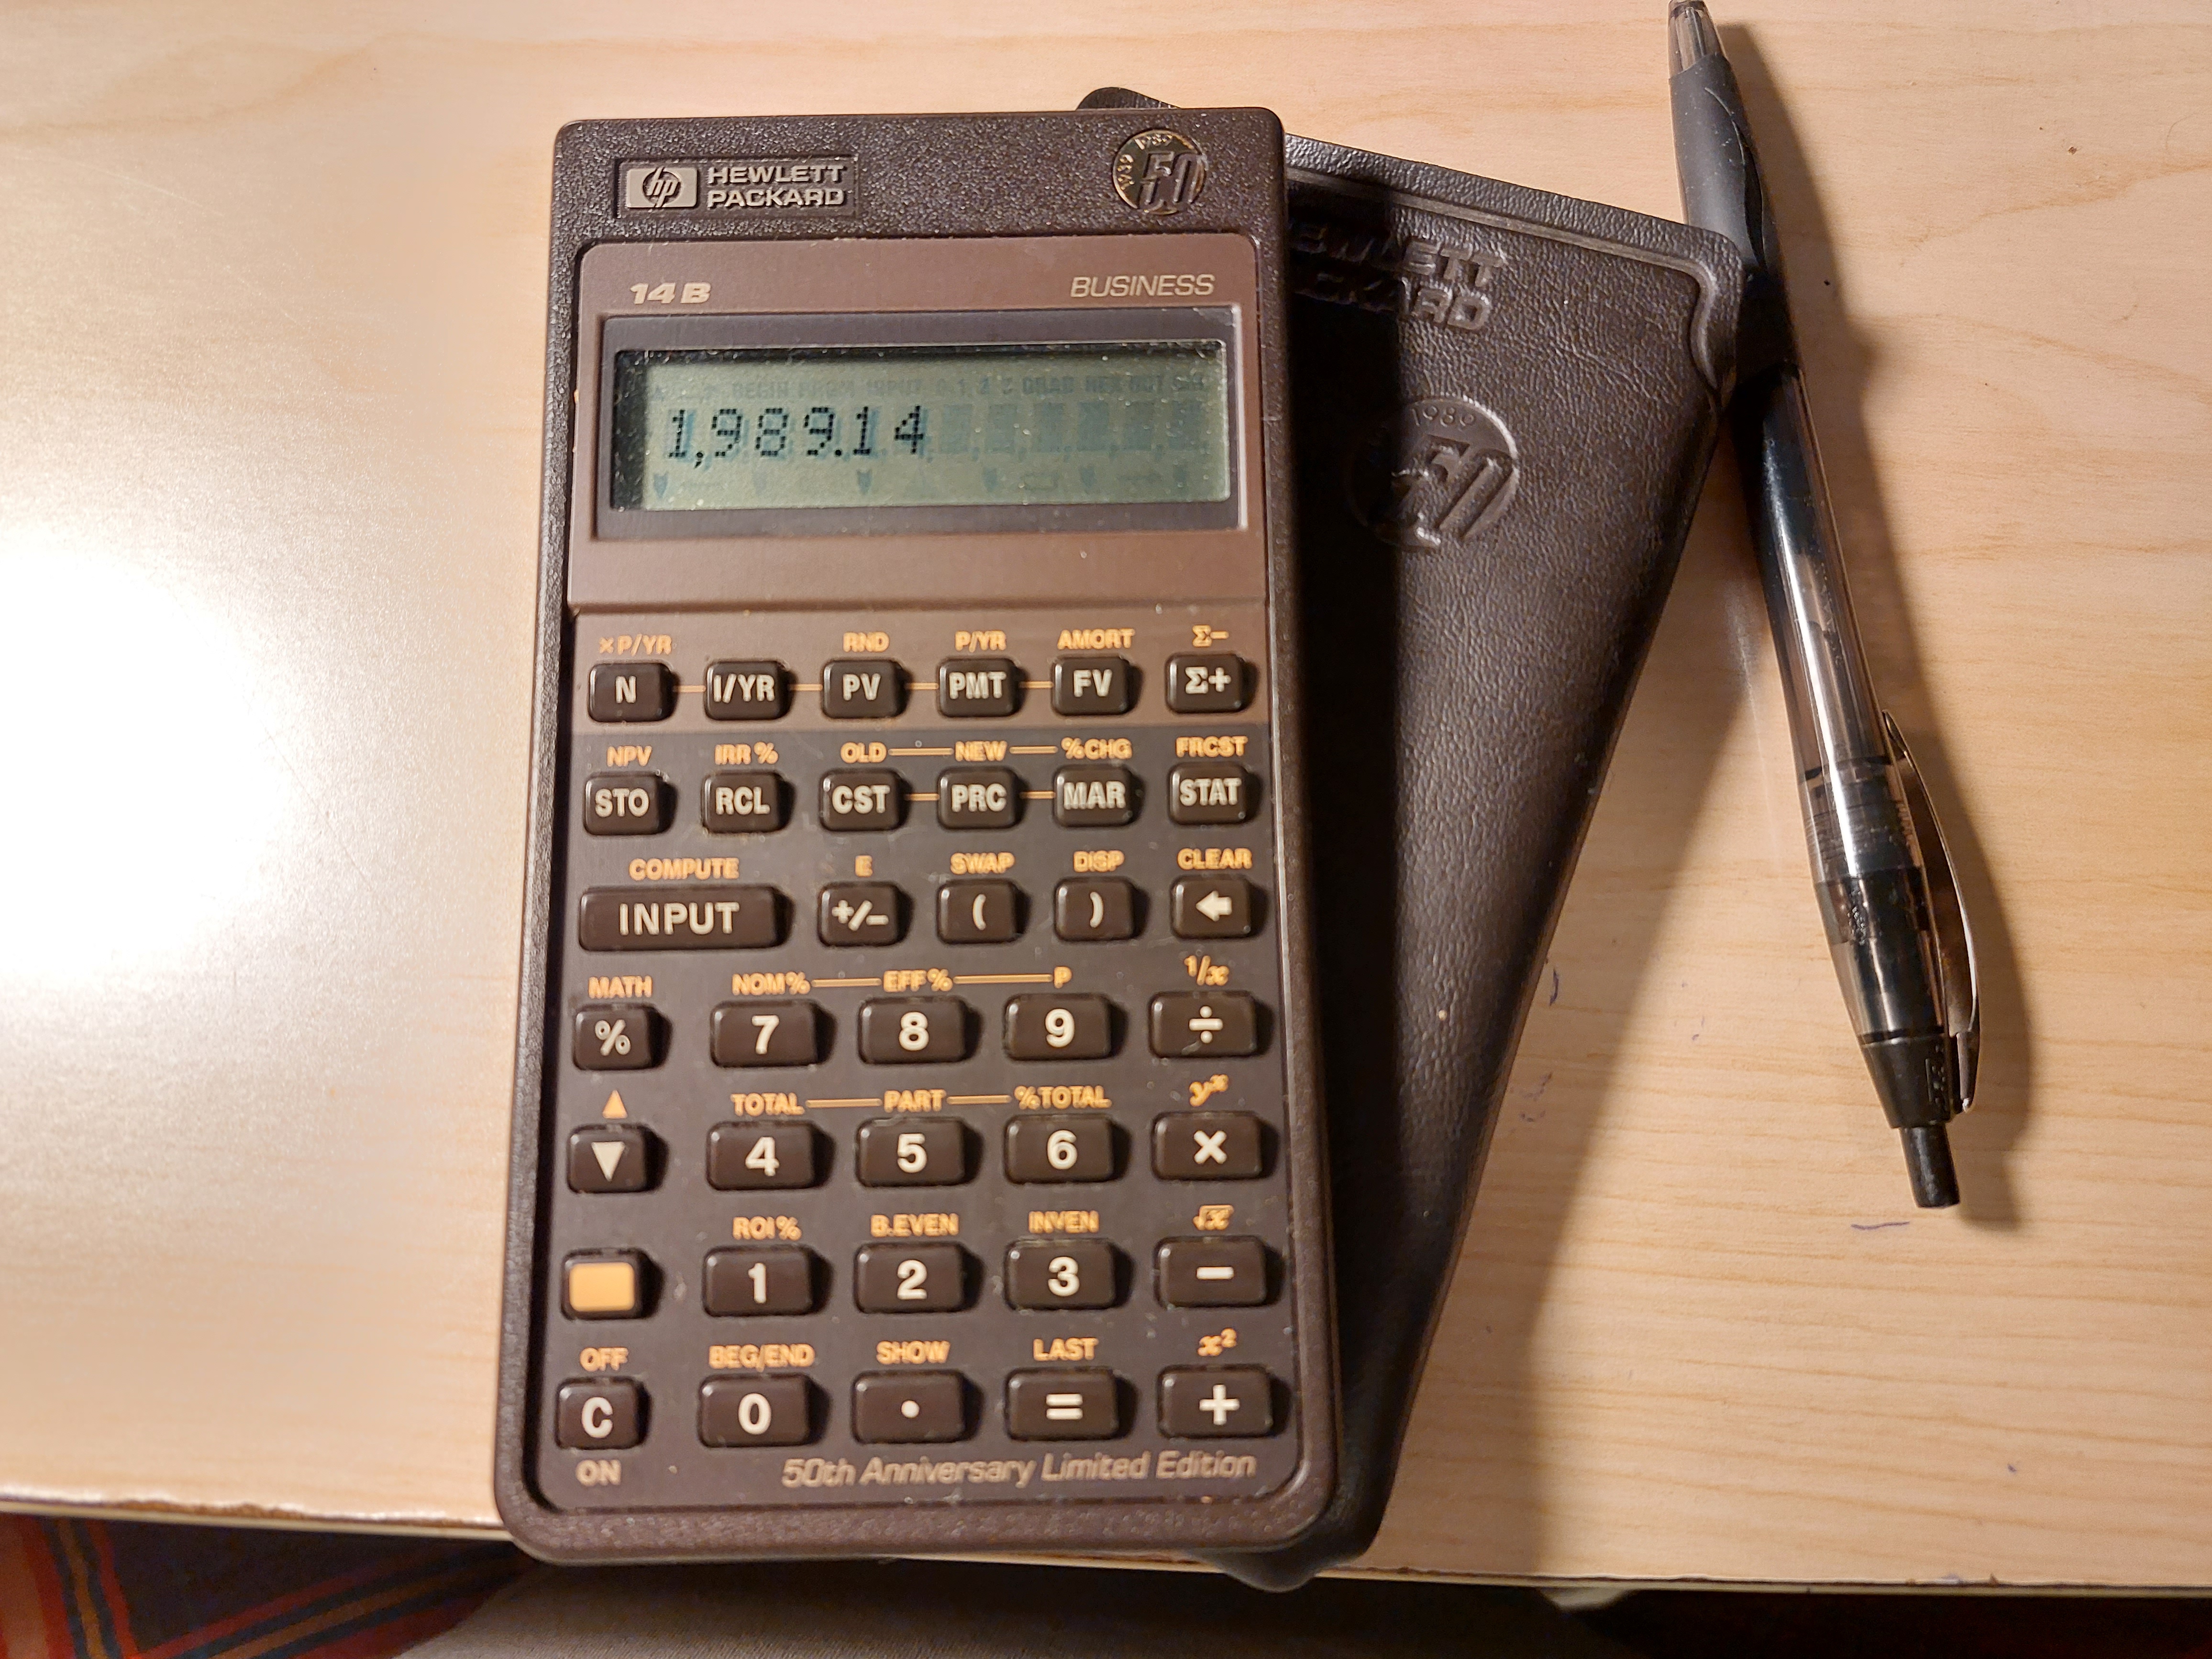
The display will not only give just numbers but will also label the variables, which I always find useful.   


Golden Anniversary


The HP 14B 50th Anniversary Edition has a gold circle with a 50 logo on the top right side of the calculator.  Also on the engravement is the years 1939 - 1989.  On the leather holder, there is also the 50/1939 - 1989 logo engraved into the leather case.   


The HP 14B 50th Anniversary edition is the same of the "normal" HP 14B calculator in terms of features and excellent keyboard.


The HP 14B is part of Hewlett Packard's pioneer series, which the series includes the HP 20S, 21S, 22S, 27S, 42S, 17B, 17BII, 10B, 32S, 32SII, and 32S 50th Anniversary Edition.  It is my favorite series of Hewlett Packard calculators, both in terms of the features the calculators have and the high quality keyboards the calculators have.


50th edition calculators are available through online auction sites such as eBay for a reasonable price.  Perhaps I may add a 32S 50th Anniversary Edition to my collection.  


Sources:


"HP 14-B 50th Anniversary Limited Edition"   Museum of HP Calculators

https://www.hpmuseum.org/hp14b50.htm   Retrieved January 11, 2023


HP 14B Business Calculator Owner's Manual.  Hewlett Packard 

October 1988.  Download the English version here:  https://literature.hpcalc.org/items/574


Eddie


All original content copyright, © 2011-2023.  Edward Shore.   Unauthorized use and/or unauthorized distribution for commercial purposes without express and written permission from the author is strictly prohibited.  This blog entry may be distributed for noncommercial purposes, provided that full credit is given to the author. 


Saturday, August 14, 2021

TI-95 ProCalc: Solving Equations With 2 Known Values, Solve for the Third Variable


TI-95 ProCalc: Solving Equations With 2 Known Values, Solve for the Third Variable 


Introduction

The two programs presented on today's blog will show an approach to program a solver where:

*  Values for two variables are known
*  The third variable is solved for automatically

We will make use of TI-95 ProCalc's user flags 01, 02, and 03 to determine which variable has entries and which variable is to be solved for.   I stored 2 into a variable (in this case, C) to count down the number of values are entered.  These programs assume that the user will always enter values for two different variables without the need to review or edit values entered.

Keys:
F1:  first variable - controlled by user flag 01
F2:  second variable - controlled by user flag 02
F3:  third variable - controlled by user flag 03

TI-95 ProCalc's flag operations:
RF:  reset flag, clear flag
SF:  set flag
TF:  tests whether a flag is set
INV TF: tests whether a flag is reset

All the variables and their values, entered or solved for, are shown at the end.

Ohm's Law

R = V / I
R = resistance in Ohms (Ω)
V = voltage in Volts (V)
I = current in Amps (A)

The program reminds the user of what units are expected in the beginning.

CHAR 244 adds Ω to the alpha string.

The alpha string '   TO ENTER' has three spaces at the beginning of the string to allow room for C.   C is merged at space 2.  

Housekeeping Items: 

RF 01 RF 02 RF 03:  Resets the flags 01, 02, and 03 at the end of the program. 

DFN CLR:  Clears the defined keys F1 - F5. 

TI-95 ProCalc File OHM
Size:  224 bytes

0 STO I STO R STO V 2 STO C

RF 01 RF 02 RF 03 CLR

'OHM'S LAW' PAU CLR

'UNITS: ' CHR 244 ',A,V' PAU

LBL A0   

CLR '   TO ENTER'  COL 02 MRG C

DEF F1: R @A1  

DEF F2: I @A2

DEF F3: V @A3

HLT 

LBL A1 STO R SF 01 DSZ C GTL A0 GTL B0

LBL A2 STO I ST 02 DSZ C GTL A0 GTL B0

LBL A3 STO V SF 03 DSZ C GTL A0 GTL B0

LBL B0 

INV TF 01 SBL B1

INV TV 02 SBL B2

INV TF 03 SBL B3

CLR 'R=' COL 16 MRG R BRK

CLR 'I=' COL 16 MRG I BRK

CLR 'V=' COL 16 MRG V  RF 01 RF 02 RF 03 DFN CLR HLT

LBL B1 RCL V / RCL I = STO R RTN

LBL B2 RCL V / RCL R = STO I RTN

LBL B3 RCL I * RCL R = STO V RTN


Examples

I = 10 A, R = 1500 Ω;  Result:  V = 15,000 V

R = 200 Ω, V = 240 V; Result:  I = 1.2 A

I = 15 A, V = 110 V; Result: = 7.333333333 Ω


Right Triangle

This programs solves any of the following variables, from knowing the other two vales: 

X:  run
Y:  rise
R:  hypotenuse

In addition, the angle (Θ) is calculated where Y is considered the opposite side and X the adjacent side.

CHECK ANG MODE:  a prompt to check angle mode, just in case you are not in the desired angle mode.   The program runs in any angle mode.

CHR 242: adds Θ to the alpha string

TI-95 ProCalc File TRI
Size:  248 bytes

0 STO X STO Y STO R STO A 2 STO C

RF 01 RF 02 RF 03 CLR

'CHECK ANG MODE' BRK 

LBL A0   

CLR '   TO ENTER'  COL 02 MRG C

DEF F1:ADJ@A1  

DEF F2:ADJ@A2

DEF F3:HYP@A3

HLT 

LBL A1 STO X SF 01 DSZ C GTL A0 GTL B0

LBL A2 STO Y ST 02 DSZ C GTL A0 GTL B0

LBL A3 STO R SF 03 DSZ C GTL A0 GTL B0

LBL B0 

INV TF 01 SBL B1

INV TV 02 SBL B2

INV TF 03 SBL B3

( RCL Y / RCL X ) INV TAN = STO A

CLR 'X=' COL 16 MRG X BRK

CLR 'Y=' COL 16 MRG Y BRK

CLR 'R=' COL 16 MRG R BRK

CLR CHR 242 '=' COL 16 MRG 

A RF 01 RF 02 RF 03 DFN CLR HLT

LBL B1 ( RCL R x^2 - RCL Y x^2 ) SQR = STO X RTN

LBL B2 ( RCL R x^2 - RCL X x^2 ) SQR  = STO Y RTN

LBL B3 ( RCL X x^2 + RCL Y x^2 ) SQR = STO R RTN

Examples

All examples are in degrees mode.

X = 3, Y = 4
Results:  R = 5, Θ = 53.13010235°

X = 11.8, R = 19.9
Results:  Y = 16.02404443, Θ = 53.63231539°

Y = 27, R = 54.4
Results:  X = 47.22668737, Θ = 29.75706329°

Commas added to the results for readability.  

Eddie

All original content copyright, © 2011-2021.  Edward Shore.   Unauthorized use and/or unauthorized distribution for commercial purposes without express and written permission from the author is strictly prohibited.  This blog entry may be distributed for noncommercial purposes, provided that full credit is given to the author. 


Tuesday, October 11, 2011

RPL Programming Tutorial - Part 9 - HP 49g+/50g: Temporary Menus and a Simple Statistics Application

Make Your Own Menus

Today in Part 9, we will create two programs where menus are created. The first one is a simple program involving free fall. The second program is a more complex menu that allows users to easily enter statistics and perform simple analysis.

Creating menus in RPL is not hard - but you really have to keep track of what you are doing because it can be easy to be lost in the symbols that are involved. These two programs may the ones to insert line breaks (done by [RS] [ . ]) to make program entry easier to see.

The menu structure in RPL is:

{ { "title" { << program >> << left shift program >> << right shift program >> } repeat the last nested list as needed }

A simplified structure is:

{ { "title" << program >>} repeat the last nested list as needed }

In Part 9, we will use the simplified structure in both the programs.

Either of the structures are followed by either MENU or TMENU.

MENU: Creates a user-defined menu and also replaces the calculator's custom menu for future use. To access the custom menu, press [LS] [MODE] (CUSTOM).

TMENU: Works the same as MENU except the user menu does not replace the calculator's custom menu for future use.

The Program FALL

This program calculates the length of a free fall of an object dropped straight down in either feet or meters. The gravitational constant is determined by the desired measurement. Air resistance is ignored in this calculation.

Comments are italicized and start with an asterisk. This program assumes the time (in seconds) is on Level 1.

g = 9.80665 m/s^2 = 32.1740468 ft/s^2

d = -1/2 * t^2 * g

[RS] [ + ] (<< >>) [LS] [ + ] ( { } ) [RS] [ . ]**
* The [RS] [ . ] sequence is the carriage return sequence and is not required. I just put the sequence in here to program entry look better.
[LS] [ + ] ( { } ) [RS] [ . ] [RS] [ x ] ( " " ) [ALPHA] [ALPHA] [F6] (F) [COS] (T) [ALPHA] [ &rarr ] [RS] [ + ] (<< >>)
* Creates the first menu key "FT"
[LS] [ √ ] (x^2) 2 [ ÷ ] 32.1740468 [ x ] [RS] [ENTER] ( &rarr NUM)
* The commands associated with "FT"
[ &rarr ] [ &rarr ] [ &rarr ] [ &rarr ]
* Exits the first nested list, you want to be in between the two right list brackets. ( } )
[LS] [ + ] ( { } ) [RS] [ . ]
[RS] [ x ] ( " " ) [ALPHA] [HIST] (M) [ &rarr ]
* Creates the second menu key "M"
[RS] [ + ] (<< >>) [LS] [ √ ] (x^2) 2 [ ÷ ] 9.80665 [ x ] [RS] [ENTER] (&rarr NUM)
* The commands associated with "M"
[ &rarr ] [ &rarr ] [ &rarr ] [ &rarr ] [ &rarr ]
* Exits the second nested list and the menu structure.
[LS] [EVAL] (PRG) [NXT] [F4] (MODES) [F5] (MENU) [F3] (TMENU)
* Enters the TMENU command - you can use the MENU command (F1) desired.
[ENTER]
* Terminates program entry

[ ' ] [ALPHA] [ALPHA] [F6] (F) [F1] (A) [NXT] (L) [NXT] (L) [ENTER] [STO>]

The completed program:

<< {
{"FT" << SQ 2 / 32.1740468 * &rarr NUM >>}
{"M" << SQ 2 / 9.80665 * &rarr NUM >>} } TMENU >>


Doesn't look that complicated does it?

Instructions:

1. Enter the time in seconds.
2. Run FALL
3. Select either [F1] for distance in feet, or [F2] for distance in meters.

Example:

I am going to drop an egg from a building. The fall lasts 3 seconds. How far did it go?

In Feet:

Run FALL, 3 [F1] (FT)

Result: 144.7832106 feet

In Meters:

Run FALL, 3 [F2] (M)

Result: 44.129925 meters

The Statistics Program

This program will allow the user to easily enter data and calculate the mean, standard deviation, and the sum of the data. The program creates a six key menu where:

* [F1] (CLEAR) clears the statistics data matrix and the stack
* [F2] (∑+) enters the next data point and clears the stack. It also returns the number of data points in the statistics data matrix.
* [F3] (∑-) deletes the latest data point and clears the stack. It also returns the number of data points in the statistics data matrix.
* [F4] (MEAN) calculates the mean of each column of the statistics data matrix.
* [F5] (SDEV) calculates the standard deviation of each column of the statistics data matrix.
* [F6] (SUM) calculates the sum of each column of the statistics data matrix.

The statistics data matrix is the system variable ∑DAT.

The Program STAT1

Note:

The key sequence [RS] [ . ] inserts a carriage return to improve readability of program entry and is not required.

[RS] [ + ] (<< >>) [LS] [ + ] ( { } ) [RS] [ . ]
[LS] [ + ] ( { } ) [RS] [ . ]
[RS] [ x ] ( " " ) [ALPHA] [ALPHA] [F3] (C) [NXT] (L) [SIN] (S) [COS] (T) [ALPHA] [ &rarr ]
[RS] [ + ] (<< >>) [RS] [SYMB] (CAT) [ALPHA] [F3] (C) find CL∑ [F6] (OK) [RS] [backspace] (CLEAR)
[RS] [ x ] ( " " ) [ALPHA] [ALPHA] [F1] (A) [NXT] (L) [NXT] (L) [SPC] [F3] (C) [NXT] (L) [F5] (E) [F1] (A) [ √ ] (R)

* The first menu item "CLST" and its instructions
[ &rarr ] [ &rarr ] [ &rarr ] [ &rarr ] [ &rarr ]
* To get in between the two right list brackets } }
[LS] [ + ] ( { } ) [RS] [ . ]
[RS] [ x ] ( " " ) [RS] [SIN] (∑) [ &larr ] [ &larr ] [backspace] [ &rarr ] [ALPHA] [ + ]
* To type "∑+ "
[ &rarr ] [ &rarr ] [RS] [ + ] (<< >>) [RS] [SYMB] (CAT) [RS] [SIN] (∑) find ∑+ [F6] (OK)
[RS] [backspace] (CLEAR)
[RS] [SYMB] (CAT) [ALPHA] [EVAL] (N) find N∑ [F6] (OK)

* The second menu item "∑+" and its instructions
[ &rarr ] [ &rarr ] [ &rarr ] [ &rarr ]
* To get in between the two right list brackets } }
[LS] [ + ] ( { } ) [RS] [ . ]
[RS] [ x ] ( " " ) [RS] [SIN] (∑) [ &larr ] [ &larr ] [backspace] [ &rarr ] [ALPHA] [ - ] [ &rarr ] [ &rarr ]
[RS] [ + ] ( << >>) [RS] [SYMB] (CAT) [RS] [SIN] (∑) find ∑- [F6] (OK) [RS] [backspace] (CLEAR)
[RS] [SYMB] (CAT) [ALPHA] [EVAL] (N) find N∑ [F6] (OK)

* The third menu item "∑-" and its instructions
[ &rarr ] [ &rarr ] [ &rarr ] [ &rarr ]
* To get in between the two right list brackets } }
[LS] [ + ] ( { } ) [RS] [ . ]
[RS] [ x ] [ALPHA] [ALPHA] [HIST] (M) [F5] (E) [F1] (A) [EVAL] (N) [ALPHA]
[ &rarr ] [RS] [ + ] (<< >>) [RS] [SYMB] (CAT) [ALPHA] [HIST] (M) find MEAN [F6] (OK)

* The fourth menu item "MEAN" and its instructions
[ &rarr ] [ &rarr ] [ &rarr ] [ &rarr ]
* To get in between the two right list brackets } } - just two menu commands to go!
[LS] [ + ] ( { } ) [RS] [ . ]
[RS] [ x ] ( " " ) [ALPHA] [ALPHA] [SIN] (S) [F4] (D) [F5] (E) [EEX] (V) [ALPHA]
[ &rarr ] [RS] [ + ] (<< >>) [RS] [SYMB] (CAT) [ALPHA] [SIN] (S) find SDEV [F6] (OK)

* The fifth menu item "SDEV" and its instructions
[ &rarr ] [ &rarr ] [ &rarr ] [ &rarr ]
* To get in the between the two right list brackets } } - last time for this program
[LS] [ + ] ( { } ) [RS] [ . ]
[RS] [ x ] ( " " ) [ALPHA] [ALPHA] [SIN] (S) [TAN] (U) [HIST] (M) [ALPHA]
[ &rarr ] [RS] [ + ] (<< >>) [RS] [SYMB] (CAT) [ALPHA] [COS] (T) find TOT [F6] (OK)

* The sixth (and final) menu item "SUM" and its instructions
[ &rarr ] [ &rarr ] [ &rarr ] [ &rarr ] [ &rarr ]
* To get past the two right list brackets } }
[LS] [EVAL] (PRG) [NXT] [F4] (MODES) [F5] (MENU) [F3] (TMENU) [ENTER]
* Enter the TMENU command and terminate program entry

[ ' ] [ALPHA] [ALPHA] [SIN] (S) [COS] (T) [F1] (A) [COS] (T) 1 [ENTER] [STO>]

The completed program:

<< {
{ "CLST" << CL∑ CLEAR "ALL CLEAR" >> }
{ "∑+" << ∑+ CLEAR N∑ >> }
{ "∑-" << ∑- CLEAR N∑ >> }
{ "MEAN" << MEAN >> }
{ "SDEV" << SDEV >> }
{ "TOT" << TOT >> } } TMENU >>


Instructions:

1. Run STAT1
2. Use the following soft keys for the following functions:

* [F1] (CLEAR) clears the statistics data matrix and the stack
* [F2] (∑+) enters the next data point and clears the stack. It also returns the number of data points in the statistics data matrix. For entering multi-variate data, see the hint below.
* [F3] (∑-) deletes the latest data point and clears the stack. It also returns the number of data points in the statistics data matrix.
* [F4] (MEAN) calculates the mean of each column of the statistics data matrix.
* [F5] (SDEV) calculates the standard deviation of each column of the statistics data matrix.
* [F6] (SUM) calculates the sum of each column of the statistics data matrix.

Hint:

In STAT1, you can enter multivariate data. To do so, first clear the statistics matrix. Then for each point, press [LS] [ x ] ( [ ] ). Separate each point with a comma or space. The press [F2] (∑+). You can operate the other commands (∑-, MEAN, SDEV, SUM) like normal.

Example:

A research company compiled retrieved a list of the last 15 winning amounts from a popular, long-running game show. The company wants to find the average winning amount, it's deviation, and the total amount won.

Data:
$ 35,000
$ 27,000
$ 15,000
$ 16,000
$ 9,000
$ 7,500
$ 34,600
$ 18,800
$ 24,300
$ 40,000
$ 11,500
$ 3,800
$ 17,600
$ 25,000
$ 35,000

Keystrokes:

Remember you can remove the last data point entered by pressing [F3] (∑-).

Run STAT1.
[F1] (CLST) - display says "ALL CLEAR"
35000 [F2] (∑+) - displays says 1
27000 [F2] (∑+) - displays says 2
15000 [F2] (∑+) - displays says 3
16000 [F2] (∑+) - displays says 4
9000 [F2] (∑+) - displays says 5
7500 [F2] (∑+) - displays says 6 (6 data entry points so far)
34600 [F2] (∑+) - displays says 7
18800 [F2] (∑+) - displays says 8
24300 [F2] (∑+) - displays says 9
40000 [F2] (∑+) - displays says 10
11500 [F2] (∑+) - displays says 11
3800 [F2] (∑+) - displays says 12
17600 [F2] (∑+) - displays says 13
25000 [F2] (∑+) - displays says 14
35000 [F2] (∑+) - displays says 15
[F4] (MEAN) - $21,340 is the average amount won.
[F5] (SDEV) - $11,303.7793933 is the standard deviation
[F6] (SUM) - $321,000 is the total winnings

This ends Part 9 of the RPL Programming Tutorial. Until next time, Eddie.


This tutorial is the property of Edward Shore. Mass reproduction and distribution requires express permission of the author.

RPN HP 12C: Fibonacci and Lucas Sequences

  RPN HP 12C: Fibonacci and Lucas Sequences Golden Ratio, Formulas, and Sequences Let φ be the Golden Ratio: φ = (1 + √5) ÷ 2...