TI-84 Plus CE: Tracing Polar Equations
Traveling Around the Graphs
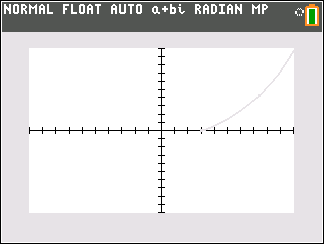
The programing BLINKING animates a dot around one of four polar equations:
1. Ellipse
r = b / √(1 - ε^2 * cos^2 θ), where ε = √(a^2 - b^2)/a, a > b
2. Cardioid
r = a + (1 + cos θ)
3. 3-Leaf Rose
r = a * cos(3 * θ)
4. Log Spiral
r = a * e^(b * θ)
Notes:
The point alternates through blue (TI-84 Plus CE color 10), green (14), orange (15), and black (12). The graph itself is light gray (21).
r1 is the polar equation r1(θ).
Plotting points (not the polar graph) must be in cartesian coordinates (x,y).
TI-84 Plus CE Program: BLINKING
"2023-01-15 EWS"
Radian: Polar: FnOff
ZStandard
{10,14,15,12}→L6
Menu("PLOT","ELLIPSE",10,"CARDIOID",11,"3-LEAF ROSE",12,"LOG SPIRAL",13)
Lbl 10
Disp "A≥B"
Prompt A, B
√(A^2-B^2)/A→E
"B/√(1-E^2*cos(θ)^2)"→r1
Goto 20
Lbl 11
Prompt A
"A*(1+cos(θ))"→r1
Goto 20
Lbl 12
Prompt A
"A*cos(3*θ)"→r1
Goto 20
Lbl 13
Disp "A>0, B>0"
Prompt A,B
"A*e^(B*θ)"→r1
Goto 20
Lbl 20
Input "MAX? ",M
Input "NO. STEPS? ",S
M/S→N
FnOn 1
GraphColor(1,21)
0→P: r1(P)→Q
P>Rx(Q,P)→F: P>Ry(Q,P)→G
Pt-On(F,G,1,12)
For(K,1,S)
Wait 0.25
Pt-On(F,G,1,21)
remainder(K,4)+1→C
K*N→P: r1(P)→Q
P>Rx(Q,P)→F: P>Ry(Q,P)→G
Pt-On(F,G,1,L6(C))
End
Disp "END"
Examples
In all examples, a = 3, b = 2, maximum = 4 * π, steps = 24
Ellipse
Cardioid
3-Leaf Rose
Log Spiral
Source
Harris, John W. and Horst Stocker. Handbook of Mathematics and Computational Science Springer: New York. 2006. ISBN 0-387-94746-9
Eddie
All original content copyright, © 2011-2023. Edward Shore. Unauthorized use and/or unauthorized distribution for commercial purposes without express and written permission from the author is strictly prohibited. This blog entry may be distributed for noncommercial purposes, provided that full credit is given to the author.


