Showing posts with label parabola. Show all posts

Friday, March 14, 2025

Casio fx-6500P Program Library 2025

Casio fx-6500P Program Library 2025


Last birthday, I reviewed the rare classic, the Casio fx-6500G:

https://edspi31415.blogspot.com/2024/03/spotlight-casio-fx-6500g.html


Casio fx-6500G


Parabola Area and Maximum Point: Program P1: Steps 114


Area Under a Parabola set up by the equation:


y = -((x – a)*(x – b)) = -x^2 + p*x – q

p = a + b

q = a * b


Cls

-((X-A)×(X-B))”

A”? →A

B”? → B

A+B → P

AB → Q

-B^3 ÷ 3 + B² P ÷ 2 – Q B + A^3 ÷ 3 - A² P ÷ 2 + Q A → R

AREA:”

R ◢

MAX PT:”

P ÷ 2 →X ◢

-((X-A)×(X-B)) → Y


The caret symbol ^ stands for [x^y].


Example:

y = -((x + 4) * (x – 2)) = -x^2 – 2*x + 8

A = -4, B = 2

Area: 36

Maximum Point: (-1, 9)


Circular Sector: Arc Length and Sector Area: Program: P2: Steps: 59


RADIUS”? →R

ANG(°)”? → T

RTπ÷180 →L

RL÷2 →A

ARC LENGTH:”

L ◢

AREA:”

A


The degree character is generated by the [° ‘ “] key.


Example:


R = 10.5, T (angle) = 120°

Results: Arc length = 21.99114858, Area = 115.45353


Integer Division: Program: P3: Steps: 51


INT÷”

“X>0”? →X

“M>0”? →M

Int(X÷M)→Q

X-M×Q→R

Q ◢

“REM”

R


Examples:


43 Int÷ 11 = 3 Rem 10


7263 Int÷ 1849 = 3 Rem 1716


Hint: To find out the number of steps in a single program? Simply scroll down the last character and hold down the [ MDisp ] key. Kind of neat because this works outside of programming mode. I think this key was available on most Casio graphing calculators well into the fx-7700G (single G) and fx-9700Gα (E,M,H) series in mid 1990’s.


95% Population Proportion: Program P4: Steps: 96


X successes out of population N


95 PRCT PROP”

X”? → X

N”? → N

X ÷ N → P

(P(1-P))→ M

1.959963984 M ÷ √N → H

P – H → L

L + 2H → H

LOW:”

L ◢

HIGH:”

H


Example:


X = 850, N = 1176

Interval:

LOW: 0.6972058859

HIGH: 0.7483723454


Interval:


Source: HP 21S Stat/Math Calculator: Owner’s Manual. Hewlett Packard. 3rd Edition. June 1990.


Power Generated by a Wind Turbine: Program P5: Steps: 82


WIND PWR”

RADIUS (M)”? →R

SPEED (M÷S)”? → V

DENSITY”? →P

π × R² × P × V^3 ÷ 2 → W

POWER:”

W


Example:


R = 8.18 m, V = 4.48 m/s, P = 1.2 kg/m³

Result: 11340.74989 W


Source: Sharp Electronics Corporation Conquering The Sciences: Applications for the SHARP Scientific Calculator EL-506A Sharp Corporation. Osaka, Japan. 1986. pp.75-77


Round to Nearest Integer (display only): Program P6: Steps: 11


?→N

Fix 0

Rnd

Norm


Examples:

N = 19.273 → 19

N = 44.8273 → 45

N = -2.82 → -3


That’s it. I wish you all a wonderful day. Thank you,


Eddie


All original content copyright, © 2011-2025. Edward Shore. Unauthorized use and/or unauthorized distribution for commercial purposes without express and written permission from the author is strictly prohibited. This blog entry may be distributed for noncommercial purposes, provided that full credit is given to the author.

Monday, November 9, 2015

HP Prime Geometry App Tutorial Part 7: Conic Sections and Equations

HP Prime Geometry App Tutorial Part 7: Conic Sections and Equations

In today’s lesson we will work conic sections and showing the equations for each of the conic sections.

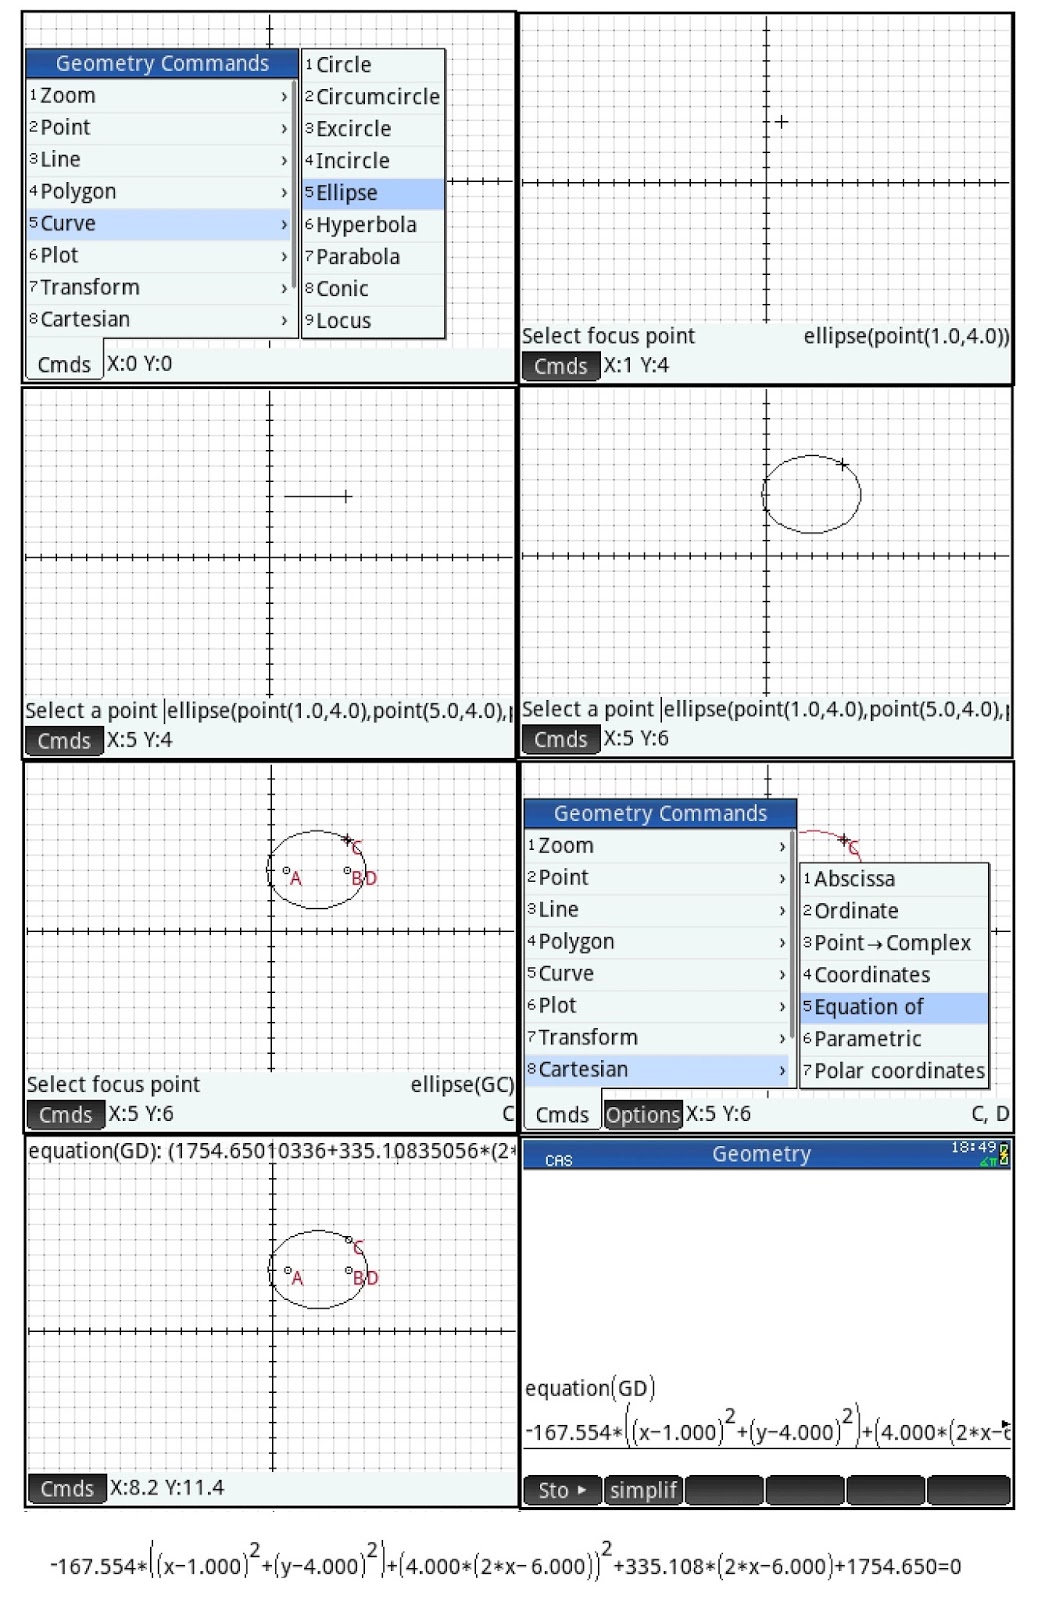
Drawing an Ellipse and Display its Equation

Command:  ellipse(focus point 1, focus point 2, point on the ellipse)

Draw an ellipse with foci (1,4) and (5,4) and the point on the ellipse on (5,6).

1.  Press (Cmds), 5 for Curve, 5 for Ellipse. 
2.  Go to the point (1,4) and press [ Enter ].
3.  Go to the point (5,4) and press [ Enter ].
4.  Go to the point (5,6) and press [ Enter ].

The next step is to display its equation. 

5.  Press (Cmds), 8 for Cartesian, 5 for Equation of.
6.  Select the ellipse and press [ Enter ].  In this example the equation is named GD.
7.  To see the whole equation, press [ CAS ] and execute the equation(GD) command.
8.  Press the up button to highlight the equation and press (Show).  Scroll to see the entire equation.


Drawing a Hyperbola and Display its Equation

Command:  hyperbola(focus point 1, focus point 2, point on the hyperbola)

Drawn a hyperbola with foci (-2, -2) and (-4, 2) with point (-9, 2).

1.  Press (Cmds), 5 for Curve, 6 for Hyperbola. 
2.  Go to the point (-2,-2) and press [ Enter ].
3.  Go to the point (-4,-2) and press [ Enter ].
4.  Go to the point (-9,2) and press [ Enter ].

The next step is to display its equation. 

5.  Press (Cmds), 8 for Cartesian, 5 for Equation of.
6.  Select the ellipse and press [ Enter ].  In this example the equation is named GD.
7.  To see the whole equation, press [ CAS ] and execute the equation(GD) command.
8.  Press the up button to highlight the equation and press (Show).  Scroll to see the entire equation.


Drawing a Parabola and Display its Equation

Command:  parabola(focus point, directrix line)

Draw a parabola with focus point (0,-5) and (0,3) is on the directrix line.

1.  Press (Cmds), 5 for Curve, 7 for Parabola. 
2.  Go to the point (0,-5) and press [ Enter ].
3.  Go to the point (0,3) and press [ Enter ].

The next step is to display its equation. 

4.  Press (Cmds), 8 for Cartesian, 5 for Equation of.
5.  Select the ellipse and press [ Enter ].  In this example the equation is named GC.
6.  To see the whole equation, press [ CAS ] and execute the equation(GC) command.
7.  Press the up button to highlight the equation and press (Show).  Scroll to see the entire equation.


On the next part, we will work with rotating geometric objects.   Thank you and see you next time,

Eddie


This blog is property of Edward Shore – 2015.  

Python – Earth’s Radius and Gravity in US Units

Python – Earth’s Radius and Gravity in US Units Introduction The following script, gravus2.py, estimates the Earth’s gravity i...