Showing posts with label Geometry app. Show all posts

Monday, November 9, 2015

HP Prime Geometry App Tutorial Part 8: Rotating Triangles

HP Prime Geometry App Tutorial Part 8:  Rotating Triangles

Today’s lesson will show how to rotate a triangle given an angle.  The angle is in a counter-clockwise direction. 

For the purpose of this lesson, we will set the HP Prime in Degrees mode.

Draw the Triangle

1.  Set the calculator to Degrees mode.  Draw a triangle with vertices (4,4), (4, -4), and (8, 0). 

Rotate the Triangle

2.  Press (Cmds), 7 for Transformation, 3 for Rotation. 
3.  Select the reference point.  In our example, let’s make this point (0,0) and press [ Enter ].
4.  You are asked for an angle.  Enter 90 for 90°.  Press [ Enter ].


More Rotation

5.  Repeat steps 2 through 4, for angles of 180 and 270.


Thank you.  Until next time, have a great day!

Eddie

This blog is property of Edward Shore.  2015.


HP Prime Geometry App Tutorial Part 7: Conic Sections and Equations

HP Prime Geometry App Tutorial Part 7: Conic Sections and Equations

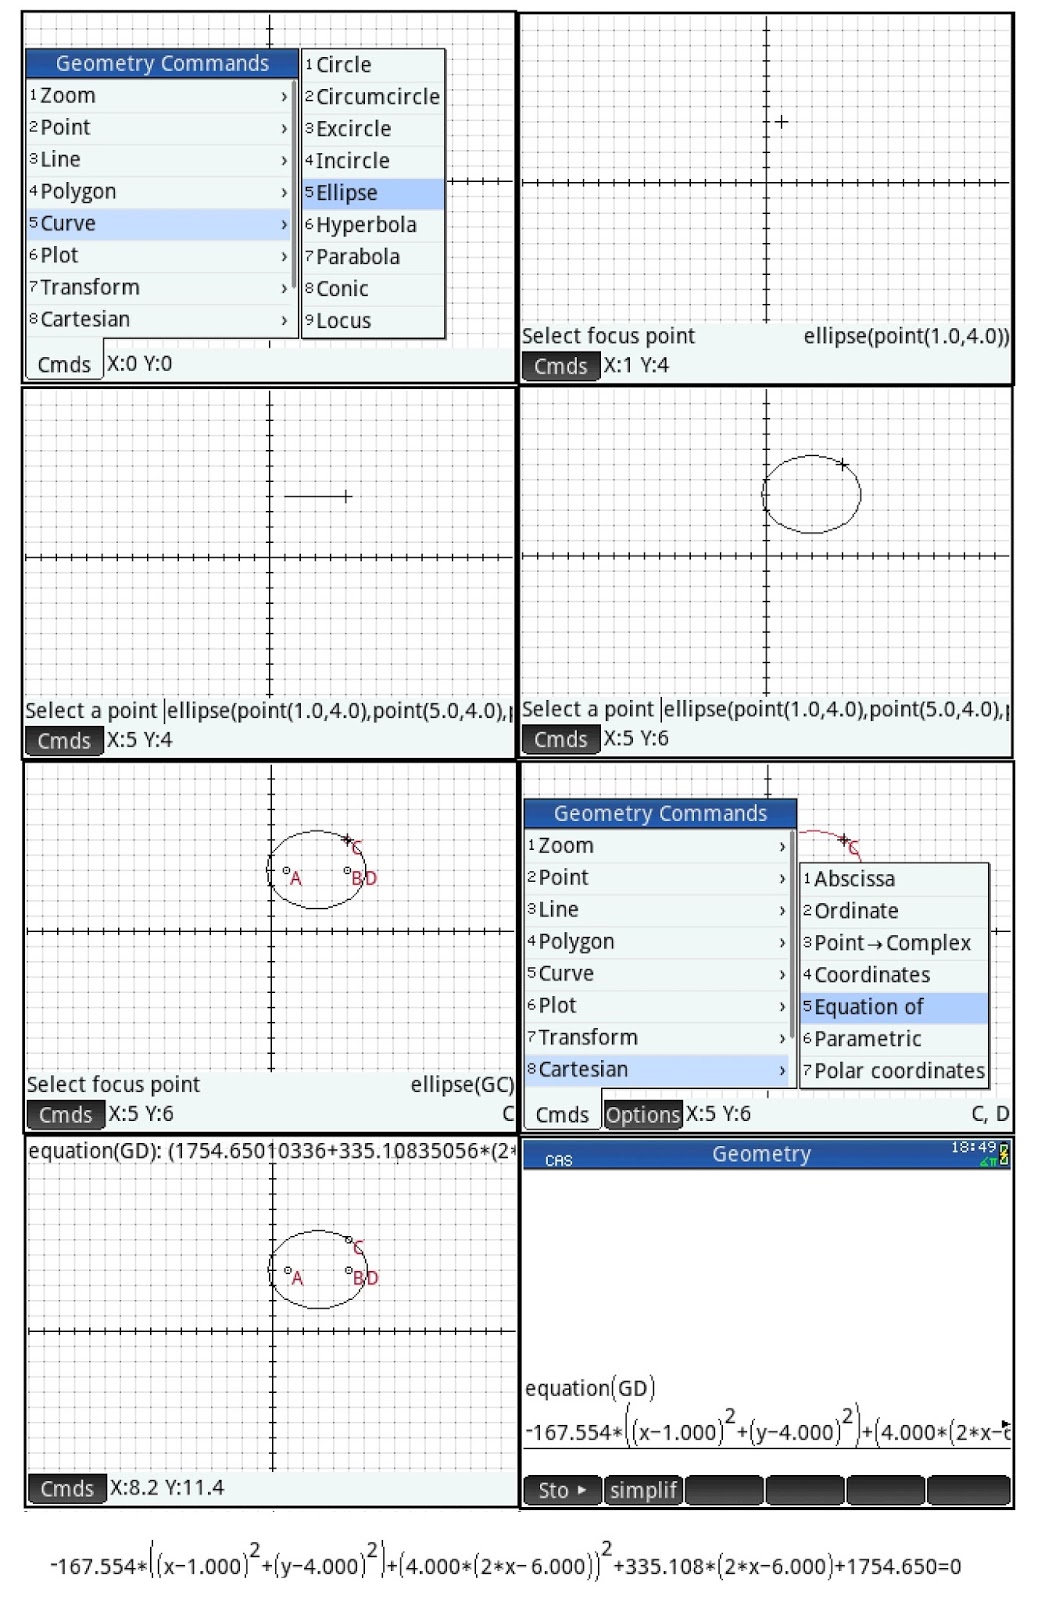
In today’s lesson we will work conic sections and showing the equations for each of the conic sections.

Drawing an Ellipse and Display its Equation

Command:  ellipse(focus point 1, focus point 2, point on the ellipse)

Draw an ellipse with foci (1,4) and (5,4) and the point on the ellipse on (5,6).

1.  Press (Cmds), 5 for Curve, 5 for Ellipse. 
2.  Go to the point (1,4) and press [ Enter ].
3.  Go to the point (5,4) and press [ Enter ].
4.  Go to the point (5,6) and press [ Enter ].

The next step is to display its equation. 

5.  Press (Cmds), 8 for Cartesian, 5 for Equation of.
6.  Select the ellipse and press [ Enter ].  In this example the equation is named GD.
7.  To see the whole equation, press [ CAS ] and execute the equation(GD) command.
8.  Press the up button to highlight the equation and press (Show).  Scroll to see the entire equation.


Drawing a Hyperbola and Display its Equation

Command:  hyperbola(focus point 1, focus point 2, point on the hyperbola)

Drawn a hyperbola with foci (-2, -2) and (-4, 2) with point (-9, 2).

1.  Press (Cmds), 5 for Curve, 6 for Hyperbola. 
2.  Go to the point (-2,-2) and press [ Enter ].
3.  Go to the point (-4,-2) and press [ Enter ].
4.  Go to the point (-9,2) and press [ Enter ].

The next step is to display its equation. 

5.  Press (Cmds), 8 for Cartesian, 5 for Equation of.
6.  Select the ellipse and press [ Enter ].  In this example the equation is named GD.
7.  To see the whole equation, press [ CAS ] and execute the equation(GD) command.
8.  Press the up button to highlight the equation and press (Show).  Scroll to see the entire equation.


Drawing a Parabola and Display its Equation

Command:  parabola(focus point, directrix line)

Draw a parabola with focus point (0,-5) and (0,3) is on the directrix line.

1.  Press (Cmds), 5 for Curve, 7 for Parabola. 
2.  Go to the point (0,-5) and press [ Enter ].
3.  Go to the point (0,3) and press [ Enter ].

The next step is to display its equation. 

4.  Press (Cmds), 8 for Cartesian, 5 for Equation of.
5.  Select the ellipse and press [ Enter ].  In this example the equation is named GC.
6.  To see the whole equation, press [ CAS ] and execute the equation(GC) command.
7.  Press the up button to highlight the equation and press (Show).  Scroll to see the entire equation.


On the next part, we will work with rotating geometric objects.   Thank you and see you next time,

Eddie


This blog is property of Edward Shore – 2015.  

HP Prime Geometry App Tutorial Part 6: Polygons

HP Prime Geometry App Tutorial Part 6:  Polygons

Drawing a Regular Polygon

1.  Clear the Plot screen.  Press (Cmds), 4 for Polygon, 9 for Regular Polygon. 
2.  Select one corner and press [ Enter ].
3.  Select another corner point and press [ Enter ].
4.  Enter the number of sides of the regular polygon.


Drawing a General Polygon

1.  Press (Cmds), 4 for Polygon, 8 for Polygon.
2.  Start with a corner point and press [ Enter ].  Keep going choosing corner points and pressing [ Enter ]. 
3.  When you finished plotting the final corner point, press [ Enter ] one last time.  This connects the last corner point with the first corner point.   Hence, it is like go to the final point and press [ Enter ] twice.


Finding Areas of the Polygon

To recall, press (Cmds), 9 for Measure, 5 for Area.  Select a polygon (when selected they turned red) and press [ Enter ].


Next time, we will work with conic sections.   Have a great day,

Eddie

This blog is property of Edward Shore – 2015.


Sunday, November 8, 2015

HP Prime Geometry App Tutorial Part 5: Plotting Functions and Differential Equations

HP Prime Geometry App Tutorial Part 5:  Plotting Functions and Differential Equations

The Geometry App can plot functions, parametric functions, polar functions, sequences, implicit statements, slope-field and ordinary differential equations, lists, and designate sliders.   

In this lesson, we will demonstrate three types of plots.   For the purpose of the tutorial, clear the Plot screen before each example.

Plotting Functions ( y = f(x))

Plot y = e^x + 1.

1.  Press (Cmds), 6 for Plot, 1 for Function. 
2.  Type e^(x) + 1.  Press (OK).

Use the lowercase x.  The format is plotfunc( y(x) ).


Plot an Ordinary Differential Equation  (y’ = dy/dx = f(x,y))

Plot y’ = y*e^x +1 with the initial condition (1,1).

1.  Press (Cmds), 6 for Plot, 7 for ODE.
2.  Type y*e^(x)+1.   Note that x and y are in lowercase.
3.  Press [ , ] and type [x,y].   Here you designate which variable is independent and which is dependent.
4.  Press [ , ] and type  [1,1].  This is your initial conditions.  Press (OK), 

The entire format is plotode( f(x,y),  [x, y], [x0, y0])


Plot a Parametric Equation  ( x(t) + i*y(t) where i = √-1)

Plot x = 3t + 1, y = 2t – 1.   The format to be used is (3t + 1) + i*(2t -1).

‘1. Press (Cmds), 6 for Plot, 2 for Parametric.
‘2. Type (3t + 1) + i*(2t -1) and press ( OK ).

The entire format is plotparam( x(t) + i*y(t), var = tbeg..tend, tstep=step).  The t is in lowercase and the last two arguments, interval and step, are optional.


In Part 6 we’ll be plotting and working with polygons.   Thanks and take care,

Eddie


This blog is property of Edward Shore.  2015. 


HP Prime Geometry App Tutorial Part 4: Tangent Lines and Changing the Color of Objects

HP Prime Geometry App Tutorial Part 4:  Tangent Lines and Changing the Color of Objects

Plotting Lines Tangent to a Circle’s Point

1.  Start with a clear plot screen.   Draw a circle:  the location of its center and size is up to you.
2.  Press (Cmds), 3 for Line, 6 for Tangent. 
3.  Select a point on the circle and press [ Enter ].  The point is designated as object GD. 
4.  If you wish, display the coordinates of GD.  See Part 3 as a refresher.

Per HP Prime’s help:  The tangent command draws one or more tangent lines through a specified point to the circle and the line segment connecting it to the radius. 

Coloring the Tangent Lines

The following steps is how to color tangent lines.  By default, geometric objects are colored black.  Adopt this procedure for any geometric object you want to designate as a specific color.

1.  Move to the tangent lines so that they turn red.   The (Optns) soft menu appears.  It is key that the (Optns) menu is available.
2.  Press (Optns), 1 for Choose Color, choose any color you want.  If the pictures, I have selected blue.  In order to see the different color, move the cursor away from the tangent lines.


What does Part 5 mean?  It’s time to plot some functions!  That is next time.  

Eddie


This blog is property of Edward Shore.  2015

HP Prime Geometry App Tutorial Part 3: Lines and Line Segments

HP Prime Geometry App Tutorial Part 3:  Lines and Line Segments

With Parts 1 and 2, we will start with a clear plot screen, with a Plot window of XRange = [ -16, 16 ], YRange = [ -11, 10.9 ], ticks are at 1.  This lesson will focus on drawing line segments, parallel, and perpendicular lines.


Midpoint on a Line

For this part, put the line segment anywhere you wish.

1.  Press (Cmds), 3 for Line, 1 for Segment.  You are prompted to select on the segment’s end points.  Press [ Enter ] to select the end point.
2. Select the other end of segment and press [ Enter ].  The segment is designated as object GC.
3.  For the Midpoint, press (Cmds), 2 for Point, 3 for Midpoint.  Select the line segment you have just drawn.  Remember, when you cursor over objects that you are about to select, that object turns red.   Press [ Enter ].   The midpoint is plotted, as object GD.  

Note that the coordinates the midpoint are not displayed.  Learn how to display the coordinates in the next segment. 


Display a Point’s Coordinates

There are two ways to display a point’s coordinates.  Try both methods and see which method works better for you.  You can use these methods of displaying the coordinates for any point.

For this exercise, we’ll concentrate on the midpoint (object GD). 

The Num Screen Method

1.  Press the [ Num ] key. 
2.  Select a blank line, press (Cmds), 1 for Cartesian, 4 for Coordinates. 
3.  Type GD and press [ Enter ].
4.  Return the plot screen by pressing [ Plot ].


The Plot Screen Method

1.  Press (Cmds), 8 for Cartesian, 4 for Coordinates.
2.  Select the point of interest, press [ Enter ].

Either way, the coordinates of the point are displayed on top of the screen.

For the next part of the lesson, please clear the plot screen. 


Draw Parallel and Perpendicular Lines

1.  Draw a line.  To recall, press (Cmds), 3 for Line, 3 for Line.  Place the line anywhere you wish, at any angle you wish.  In the pictures that are displayed, I just chose to place a horizontal line for demonstration purposes (boring, huh?)
2.  Parallel Line:   Press (Cmds), 3 for Line, 4 for // (Parallel) .  Select the line you drew and press [ Enter ].  Place the parallel line with a second [ Enter ].   A parallel line is drawn.
3.  Perpendicular Line:  Press (Cmds), 3 for Line, 5 for ⊥  (Perpendicular).  Select either of the lines and press [ Enter ].  Place the perpendicular lines by pressing [ Enter ].


In Part 4 we will work with drawing tangent lines and how to color objects.

This blog entry is coming from me enjoying a pumpkin vanilla latte at The Coffee Bean & Tea Leaf in Monrovia, CA.   Hope you day is wonderful and see you next time!

Eddie


This blog is property of Edward Shore. 2015. 

Friday, November 6, 2015

HP Prime Geometry App Tutorial Part 2: Triangles

HP Prime Geometry App Tutorial Part 2:  Triangles

Like Part 1, we’ll use a Plot window of XRange = [ -16, 16 ], YRange = [ -11, 10.9 ], ticks are at 1.  For this lesson, we are going to focus on triangles.  Start with a clear Plot Screen ([Shift], [ Esc ] (Clear)).

Drawing a Triangle

1.  On the plot screen, press the soft key (Cmds), then select 4 for Polygon and 1 for Triangle. 
2.  Select the first vertex (corner point) and press [ Enter ].  For this lesson, put the triangle wherever you want.
3.  Place the second and third vertex.  Press [ Enter ] after each point.  The vertices are labeled A, B, and C. 


Finding an Angle

The steps will demonstrate how to find the angle.  Be aware that the direction you enter the vertexes will determine the sign of the angle. 

1.  Press (Cmds), 9 for Measure, 6 for Angle.
2.  Select one vertex, press [Enter].  Follow the triangle to select the second vertex (where the angle will be measured), press [ Enter ].  Follow that with a third vertex and press [Enter].  The angle displayed on top of the screen.


Resizing the Triangle

Click on one of the points of the points.  Then drag the point with the arrow pad.  When satisfied, press [ Enter ].


For the last part, clear the screen.

Reflect a Triangle – reflect about a point

1.  Clear the screen.  ([ Shift ] [ Esc ] (Clear))
2.  Draw a triangle with the vertices (-6, -4), (-6, 4), and (-12, 0).
3.  Press (Cmds), 7 for Transform, 2 for Reflection.
4.  You will be promoted for a reflection point.  For this exercise, set the point at (0,0). 
5.  Select the triangle (scroll until the triangle turns red) and press [ Enter ].


In Part 3, we’re going to work with lines and line segments.  Until next time, have a great day!

Eddie


This blog is property of Edward Shore.  2015.


Thursday, November 5, 2015

HP Prime Geometry App Tutorial Part 1: Circles

HP Prime Geometry App Tutorial Part 1:  Circles

This tutorial series will focus on the HP Prime’s Geometry App.  Most of the time we will focus on the Plot screen.  The software version that we are working with is Build 8151 (6/17/2015).

Setting Up the Plot Screen

For the tutorial, I am going to set the plot screen with the following parameters:  XRange = [-16, 16], YRange = [-11, 10.9], and the ticks for both axes are 1.


Steps:

1.  Press [ Shift ], [ Plot ] (Plot Setup).
2.  Set up the parameters as shown below.  Note that the Xmax and Ymax are automatically set.  I also recommend that you set the calculator to Degrees mode through the Settings Menu.


For this lesson, we are going to draw a circle, draw its radius, find its circumference, and its area.

Draw a Circle

1. Press [ Plot ] to go the plot screen.  If necessary, clear the workspace by pressing [ Shift ], [ Esc ] (Clear). 
2.  Press the soft menu key (Cmds), select 5 for Curve, 1 for Circle.  You are prompted to determine where the center of the circle.  
3. For this lesson, just move the cursor, or click on/touch the screen anywhere you like.  Press [ Enter ] to anchor the circle’s center.
4.  Select a point to determine who far the circle expands.  Pressing [ Enter ] will draw the circle, and plot the point you selected on the circle’s edge.


Note how everything is labeled.  A is the center, B is the outer point, and C is the circle.  If you were to refer to these objects outside of the plot screen (like the Num screen or the CAS Home screen), you will need to have a G (capital “G”) suffix attached, like this: GA, GB, GC. 

Draw the Radius of a Circle

1.  Go to the center of the circle (point A).  You can scroll your cursor by using the arrow keys or touch on/click on the screen.  As of the current version (8151), there is no “Go To” feature (hopefully on a future update).
2.  Press (Cmds), 3 for Line, 1 for Segment.  Select the center by pressing [ Enter ].
3.  Select any of the circle’s edge and press [ Enter ].  The radius, represented by the line segment is drawn.


Measuring the Circle’s Radius (the easy way)

1.  Press (Cmds), 9 for Measurement, 2 for Radius.
2.  Select the circle.  When the circle is selected when it turns red.  Press [ Enter ].
3.  The result will be on top of the Plot screen.


Measuring the Circle’s Area

1.  Press (Cmds), 9 for Measurement, 5 for Area.
2.  Like the last exercise, select the circle.  Again, you know if the circle is selected (by the cursor’s placement) if the circle is red.  Press [ Enter ].
3.  The circle will filled with color and the result will be on top of the Plot screen.


That is going to wrap up Part 1 of the HP Prime Geometry App Tutorial.  In Part 2, we’ll be working with Triangles, finding angles, re-sizing, and reflecting triangles.  Until then, have a great day!

Eddie


This blog is property of Edward Shore.  2015. 


Python – Earth’s Radius and Gravity in US Units

Python – Earth’s Radius and Gravity in US Units Introduction The following script, gravus2.py, estimates the Earth’s gravity i...