Friday, June 23, 2017

HP Prime and Casio fx-CG50: Trapezoid Midsegment, Height, Area

HP Prime and Casio fx-CG50:  Trapezoid Midsegment, Height, Area


The program TRAPEZ calculates the following:

Midsegment length:  M = (A + B)/2

Height:  H = √( (-A+B+C+D)(A-B+C+D)(A-B+C-D)(A-B-C+D) )/(2 * abs(B-A))

Area:  K = M * H

HP Prime Program TRAPEZ

EXPORT TRAPEZ()
BEGIN
// trapezoid
// 2017-06-23 EWS

INPUT({A,B,C,D},
"Trapezoid",
{"a: ","b: ","c: ","d: "},
{"Top","Bottom","Left","Right"});

M:=(A+B)/2;
I:=(−A+B+C+D)*(A-B+C+D)*(A-B+C-D)*
(A-B-C+D);
IF I≤0 THEN
PRINT();
PRINT("Invalid Trapezoid");
ELSE
H:=√(I)/(2*ABS(B-A));
K:=H*M;
PRINT();
PRINT("Midlength = "+M);
PRINT("Height = "+H);
PRINT("Area = "+K);
END;

END;

Casio fx-CG50 Program TRAPEZ

"TOP"?->A
"BOTTOM"?->B
"LEFT"?->C
"BOTTOM"?->D
(A+B)/2->M
((-)A+B+C+D)(A-B+C+D)(A-B+C-D)(A-B-C+D)->I
If I<=0
Then
"INVALID TRAPEZIOD"DispsElse
√I/(2Abs (B-A))->H
M*H->K
ClrText
Locate 1,1,"MIDLENGTH="
Locate 1,2,M
Locate 1,3,"HEIGHT="
Locate 1,4,H
Locate 1,5,"AREA="
Locate 1,6,K
IfEnd

Example

A = 13, B = 23, C = 6, D = 7
Results:
Midlength, M = 18
Height, H = 4.139493194
Area, A = 74.3848775

Source:
“Trapezoid”  Wikipedia.  Edited July 7, 2014.  Retrieved July 8, 2014

Eddie


This blog is property of Edward Shore, 2017.

HP Prime and Casio fx-CG 50: Phase of the Moon, C++ Translations to Calculator

HP Prime and Casio fx-CG 50: Phase of the Moon, C++ Translations to Calculator 

Moon Phase Program 

The following program calculates the approximate phase of the moon.  Calculation is based on the following:

1.  A base date of August 11, 1999 is used, which was a New Moon.
2.  The phases of the moon cycles approximately 29.530588853 days

The results is a phase indicator from 0 to 1. 

If the indicator is close to 0 or 1, we have a New Moon.
If the indicator above 0 but below 0.5, it’s the Waxing Crescent Moon.
If the indicator is about or exactly 0.5, we have a Full Moon.
Finally, for an indicator from 0.5 to 1, it’s the Waning Crescent Moon.

Examples:
June 23, 2017:  the indicator is 0.991190947
June 24, 2017:  the indicator is 0.025054136

Values are approximate.


HP Prime Program:  MOONPHASE

Input:  MOONPHASE(yyyy.mmdd)

EXPORT MOONPHASE(d)
BEGIN
// Moon phase
// 0,1: New; 0.5: Full
LOCAL t,p;
t:=DDAYS(1999.0811,d);
p:=FP(t/29.530588853);
RETURN p;
END;

Casio Program:  MOONPHSE

"EWS 2017-06-23"
"MONTH"?->M
"DAY"?->D
"YEAR"?->Y
Days_Prd(8,11,1999,M,D,Y)->T
Frac (T/29.530588853)->P

ClrText
Locate 1,1,"PHASE %:"
Locate 1,2,"0,1: NEW,0.5: FULL"
Locate 1,3,P


Source:  “Moon Phase”  voidware.  http://voidware.com/moon_phase.htm


Bonus:  From C to Calculator

The program presented on the source is written in C (C++?).  Translating from C to calculator language took a little research (confession: I’m not a C expert). 

var++  increment variable by 1.  (var + 1 → var)
var--  decrement variable by 1.  (var – 1 → var)
+=  storage addition (STO+,  var + value → var)
-=   storage subtraction (STO-, var – value → var)
*=  storage multiplication (STO*, var * value → var)
/=  storage division  (STO/,  var/value → var)
&   and
||  or
%  mod
‘! not

Source:  “C – Operators” Tutorials Point  - Simple Easy Learning https://www.tutorialspoint.com/cprogramming/c_operators.htm  Retrieved June 23, 2017

Eddie

This blog is property of Edward Shore, 2017


Wednesday, June 21, 2017

HP Prime and Casio fx-CG50: Basic Spreadsheet Comparison

HP Prime and Casio fx-CG50:  Basic Spreadsheet Comparison


HP Prime
Casio fx-CG50
Maximum Spreadsheet Size
10,000 rows by 676 columns
999 rows by 26 columns
Accessing Spreadsheet mode
[Apps], Spreadsheet
[MODE], 4
Creating and saving files
The Spreadsheet app can be copied and renamed
Files can be created and saved.  The fx-CG50 stores spreadsheets as separate files.
Clearing the entire spreadsheet
[Shift], [Esc] (Clear), pressing OK
From the main menu: [ F3 ] (DELETE), [ F3 ] (ALL), [ F1 ] (OK)
Inserting text labels in cells
[ALPHA], [ 0 ] (“ “)
[ALPHA], [ *10^ ] (“).  Text cells are indicated by a solid black strip on the left side of the cell.
Inserting the colon character, for ranges (:)
[ALPHA], [ - ] ( : )
During cell entry/edit, [ F3 ] ( : )
Inserting the dollar sign character, for absolute cell references ($)
During cell entry/edit, the touch key ( $ )
During cell entry/edit, [ F2 ] ( $ )
Starting a formula with the equals sign (=)
[Shift], [ . ] ( = )
[Shift], [ . ] ( = )
The SUM function
During formula entry:  [Toolbox], (App), Spreadsheet, SUM
During formula entry:  [ F5 ] (CELL), [ F5 ] (Sum).  The function is named CellSum.
The AVERAGE function
During formula entry: [Toolbox], (App), Spreadsheet, AVERAGE
During formula entry: [ F5 ] (CELL), [ F3 ] (Mean). The function is named CellMean.
The IF function
During formula entry:  [Toolbox], (Ctlg), select when
Syntax:  when(condition, do if true, do if false)
During formula entry:  [ F5 ] (CELL), [ F4 ] (CellIf). 
Entering a random number
During formula entry:  [Toolbox], 5. Probability, 4.  Random:
1 for random number:  RANDOM()
2 for random integer:  RANDINT(a,b)
During formula entry:  [OPTN], [ F5 ] (PROF), [ F4 ] (RAND)
[ F1 ] for random number: Ran#
[ F2 ] for random integer: RandInt#(a,b)
Change text color
(Format), 4. Color, select color
[Shift], [ 5 ] (FORMAT), 1. Char Color, choose color, [EXIT]
Change cell color
(Format), 5. Fill, select color
[Shift], [ 5 ] (FORMAT), 2. Area Color, choose color, [EXIT]
Number of colors
16,777,216.  18 set colors, plus one master color selector
8 colors:  black, blue, red, magenta, green, cyan, yellow, white
Selecting a Group of Cells
Press the soft key (Select), choose cells, turn off by pressing (Sel *)
[Shift], [ 8 ] (CLIP), choose cells, turn of by pressing [EXIT]
Sizing columns
Go to top of the column, press (Format), 8, # of bytes
Use -1 for auto sizing
(not available)
Number format (number of decimal places)
Select cells, (Format), 1.  Number Format.  Select 8 to select the number of decimal places
(not available)
Conditional Formatting
(not available)
[ F6 ] ( > ), [ F5 ] (CONDIT), complete the prompt
Filling a formula
Select the source cell and copy it ([ Shift ], [ View ]).  Select target cells and paste the formula ( [ Shift ], [ Menu ], [ → ], select Formula)
Select the target cell range, [ F2 ]  (EDIT), [ F6 ] ( > ), [ F1 ] (FILL)
Plotting a scatter plot
(not available)
Select range, [ F6 ] ( > ), [ F1 ] (Graph), [ F1 ] or [ F2 ] or [ F3 ] for Graph1, Graph2, or Graph3, respectively
Trend line analysis – Linear Regression
Go to an output cell, [ Shift ], [ . ] (=),[Toolbox], (App), Spreadsheet, REGRS
Syntax: REGRS(range, 1)
Select range, [ F6 ] ( > ), [ F2 ] (CALC), [ F3 ] (REG), [ F1 ] (X), [ F1 ] (ax+b).  Results are shown.  Recall separate variables through VARS-STAT-GRAPH

Do you use the spreadsheet mode on your calculator?  Check it out if you have not done so. 

Happy First Days of Summer (Northern Hemisphere)/Winter (Southern Hemisphere)!

Eddie


This blog is property of Edward Shore, 2017

Saturday, June 17, 2017

Casio fx-CG50 Review (updated 3/2/2018)

Casio fx-CG50 Review


Company:  Casio
Type: Scientific/Graphing
Price:  (about) $119
Battery: 4 AAAs
Memory: 60 KB RAM, 14 MB Flash
Colors:  Can display up to 65,536 colors, graphing and text can be use up to 8 colors

I’m going to focus more on the new and updates in this review.
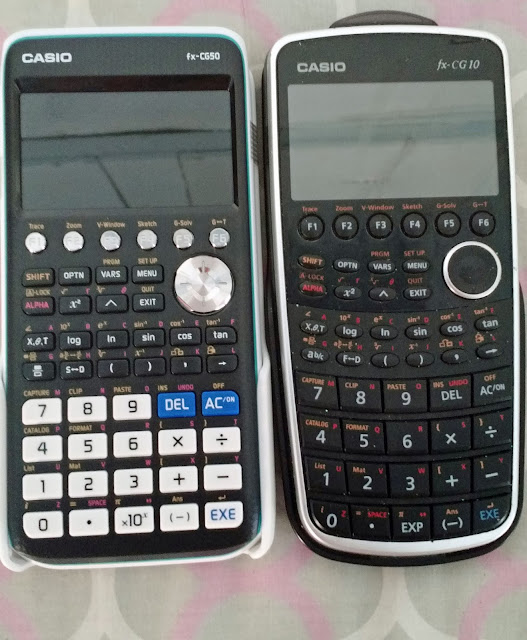

2017 fx-CG50 on the left, 2011 fx-CG10 on the right


Keyboard

The fx-CG50 is an update of the popular 2011 Casio Prizm (model fx-CG10 or fx-CG20).  The fx-CG50 has an updated keyboard, in the style of the new fx-260 SOLAR and Casio FX-991 ES.  As a result, the keys are easier to read, more consistent to the touch and size.  In the previous keyboard (fx-CG10/20), the number keys were large but the function keys were very small.

The Screen

Like the previous fx-CG10/20, the diagonal of the screen is 3.17 inches.  However, the screen of the fx-CG50 is brighter. 

Processing Speed

Although I wasn’t able to find anything about the chip or its speed, the fx-CG50 seems to operate faster in accounts.   

I tested a sample program:

For 1 → A To 1000
ClrText
Locate 2,1,A
Next

On the fx-CG10, the program took 1 minute, 24.83 seconds to complete.  With the fx-CG50, the program took just 34.87 seconds, a reduction of 58.89%.

General Features
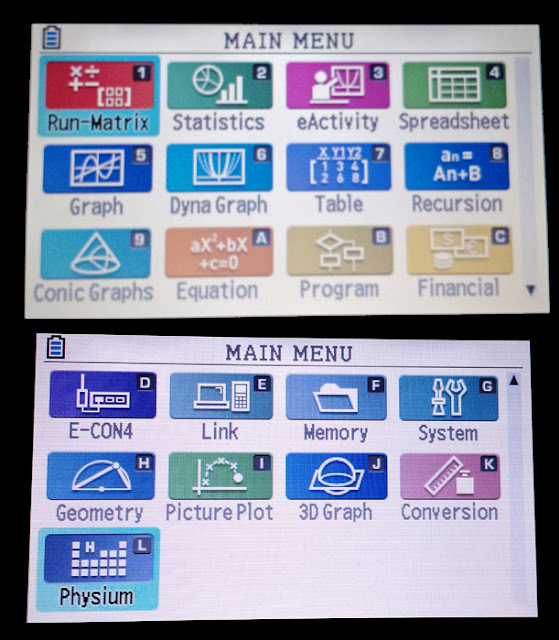
fx-CG50 Menu selection screen

* Financial Solver: Time Value of Money, Days between Dates, Bonds
* Recursive, Polar, Function, Parametric, Inequality, and Conic Section Graphing
* General Function Solver
* Polynomial Solver: up to the 6th degree, coefficients must be real, but roots can be complex numbers
* Simultaneous Equation Solver:  up to 6 x 6 linear equations, can include complex numbers
* Number of Statistic Regressions (curve fitting): 12

Also textbook entry, calculus, and full complex number (yes that includes exponential, logarithms, and trigonometric functions of complex numbers – yes I’m happy about this!**).  Base calculations include binary, octal, decimal, and hexadecimal integers.

** As of OS 3.10, trig functions no longer accept complex numbers.  Why Casio why?  (3/2/2018)

Additional modes include Geometry, Conversion, and Spreadsheet.  3D graphing is new to the fx-CG50.

Graphs can be used in one of 8 colors: black, blue, red, magenta, green, cyan, yellow, and white.  This palette is the same of the SECAM palette shown on certain Atari 2600 machines.  (Link:  https://en.wikipedia.org/wiki/List_of_video_game_console_palettes#Atari_2600 )

3D Graphing

The 3D graphing mode offers one of four possible types: line, plane, sphere, and cylinder.  Each of the types offer various formats to enter coefficients.  Keep in mind these are the only four types of 3D graphs offered.  The graph has full zoom features and it is pretty snappy with regards to rotation.  


Physium

Physium is included with the fx-CG50.  There are two features with the Physium:  Periodic Table and Physical Constants.

Periodic Table:  an underrated feature.  You can display the entire table, or zoom in to a portion of the table.  The atomic weight of each element can be stored in a variable (A through Z).


Physical Constants:  Choose between 39 physical constants from five categories: Universal (speed of light, electric constant, Newton’s constant of gravitational, etc.), Electromagnetic constants, Atomic & Nuclear constants, Physico-Chemical constants (Avogardo constant, molar gas constant, etc), and three Adopted Values (Josephson constant, Klitzing constant, standard acceleration of gravity).  Units are in SI.


Verdict

If you don’t have a Casio fx-CG10/20 and are interested in getting the updated version, go for it.  I also think getting the update is worth it primarily for the faster processing speed, brighter screen, and much better keyboard as far as contrast on the labels and key size.  Obviously Casio is very consistent with the programming language, so if you are upgrading from a previous non-color or three-color version, you should feel right at home with the fx-CG50.  The one thing I wish the fx-CG50 had was more RAM instead of only the 60KB from fx-CG10.  It’s not terrible, but given the TI-84 Plus CE has 128K RAM, Casio should have at least matched that amount.

Eddie


This blog is property of Edward Shore, 2017

Monday, June 12, 2017

HP Prime and Casio fx-9860GII/Prizm: Angular Distance Between Stars

HP Prime and Casio fx-9860GII/Prizm:  Angular Distance Between Stars

Given the right ascension (α) and declination (δ) of two stars of the same epoch (J2000.0 is the most current), the distance between the stars are:

d = acos( sin δ1 * sin δ2 + cos δ1 * cos δ2 * cos (α1 – α2) )

The distance is usually given in decimal degrees.

Enter α in terms of hours, minutes, seconds (standard notation) and δ in terms of degrees, minutes, seconds (standard notation).

HP Prime Program:   ANGSTAR

EXPORT ANGSTAR(α1,δ1,α2,δ2)
BEGIN
// 2017-06-08 EWS
// Angular Angle

// Degrees
HAngle:=1;

LOCAL d;

α1:=15*α1;
α2:=15*α2;

d:=ACOS(SIN(δ1)*SIN(δ2)+
COS(δ1)*COS(δ2)*COS(α1-α2));

RETURN →HMS(d);
END;

Casio fx-9860GII/Prizm Program:  ANGSTAR

Deg
“RA 1: “?→A
“DEC1: “?→B
15A→A
“RA 2: “?→C
“DEC2: “?→D
15C→C
cos¯¹ (sin B * sin D + cos B * cos D * cos (A-C))→E
E>DMS

Example

Distance between Regulus (A) in Leo and Sadalmelik in Aquarius:

(data via Wikipedia)
Regulus:  α = 10h8m23.11s,  δ = +11°58’01.95”

Sadamelik:  α = 22h5m47.03593s, δ = -0°19’11.4568”

Distance:  168°20’05.1793”

Source:
Meeus, Jean.  Astronomical Algorithms  William-Bell, Inc.  Richmond, VA 1991.  ISBN 0-943396-35-2


Please stay safe, happy, and sane. Happy computing,

Eddie

I hope to have the new Casio Prizm FX-CG50 soon for review as I ordered one last Friday. 

This blog is property of Edward Shore, 2017.

Sunday, June 11, 2017

HP 12C Minimum and Maximum

HP 12C Minimum and Maximum


HP 12C: Minimum of a Set

Instructions:
1. Enter the initial point in R1.  Press [ f ] (CLEAR PRGM).
2. For each point: enter the data point, press [R/S].
3. When you are finished, press RCL 1.

Program:
STEP
CODE
KEY
01
44, 0
STO 0
02
45, 1
RCL 1
03
34
x<>y
04
43, 34
x≤y
05
44, 1
STO 1
06
43, 33, 00
GTO 00


Example:
9 [ST0] 1, [ f ] (CLEAR PRGM)
3 [R/S], 6 [R/S], 5 [R/S], 7 [R/S], 2 [R/S], 4 [R/S]
[RCL] 1 returns 2

HP 12: Maximum of a Set

Instructions:
1. Enter the initial point in R2.  Press [ f ] (CLEAR PRGM).
2. For each point: enter the data point, press [R/S].
3. When you are finished, press RCL 2.

Program:
STEP
CODE
KEY
01
44, 0
STO 0
02
45, 2
RCL 2
03
43, 34
x≤y
04
34
x<>y
05
44, 2
STO 2
06
43, 33, 00
GTO 00

Example:
9 [ST0] 2, [ f ] (CLEAR PRGM)
3 [R/S], 6 [R/S], 5 [R/S], 7 [R/S], 2 [R/S], 4 [R/S]
[RCL] 2 returns 9

Nice pair of programs to have.  Yes, they can be incorporated in more complex routines.

Eddie


This blog is property of Edward Shore, 2017.

Numworks: Allowing Repeated Calculations in Python

Numworks: Allowing Repeated Calculations in Python Introduction Say we want the user to repeat a calculation or a routine for as lo...