HP Prime: Testing Random Normal Distribution Generators
Introduction
The HP Prime's randNorm generates random numbers to fit a normal distribution curve. The Box-Muller Method is used, and calls for the use of the formula:
x1 = √(-2 * ln u1) * cos(2*π*u2)
where
u1 and u2 came from random generated numbers which takes the values in the range [0, 1).
The Box-Muller Method also includes a second formula, which isn't used by the calculator:
x2 = √(-2 * ln u1) * sin(2*π*u2)
I imply that the radians mode is used in this calculation.
What about using the direct normal distribution function?
(I) y = 1/√(2*π) * e^(-x^2/2)
Where y represents the probability and the maximum value y can take is when x=0:
(II) y = 1/√(2*π)
Solving (I) for x returns the solution:
(III) x = ± √(-2*ln(y*√(2 * π)))
Can (III) be a generator of random numbers that fit a normal distribution?
TESTBX uses the cosine portion of the formula to generate random numbers:
x = √(-2 * ln u1) * cos(2*π*u2)
While TESTND uses the following formula to generate random numbers:
x = u2 * √(-2*ln(u1*√(2 * π)))
where: u1 a random number between [0, 1) and u2 is either -1 or 1 chosen at random. To accomplish the -1 or 1 choice, I use a wide range of random integers.
The programs generate a list of 300 data points and I used a histogram plot of four samples to see whether the sample fits a normal curve. While this isn't a rigorous proof, the plots give an idea of what the results would look like.
HP Prime Program: TESTBX
EXPORT TESTBX()
BEGIN
// Box-Muller, 300 points
// EWS 2021
// Radian mode
HAngle:=0;
LOCAL u1,u2,i,x,l;
l:={};
FOR i FROM 1 TO 300 DO
u1:=RANDOM();
u2:=RANDOM();
x:=√(−2*LN(u1))*COS(2*π*u2);
l:=CONCAT(l,{x});
END;
RETURN l;
END;
HP Prime Program: TESTND
EXPORT TESTND()
BEGIN
// Normal Dist, 300 points
// EWS 2021
// Radian mode
HAngle:=0;
LOCAL u1,u2,i,x,l,m;
l:={};
FOR i FROM 1 TO 300 DO
// maximum
m:=1/√(2*π);
u1:=m*RANDOM();
u2:=SIGN(RANDINT(−100,101));
x:=u2*√(−2*LN(u1*√(2*π)));
l:=CONCAT(l,{x});
END;
RETURN l;
END;
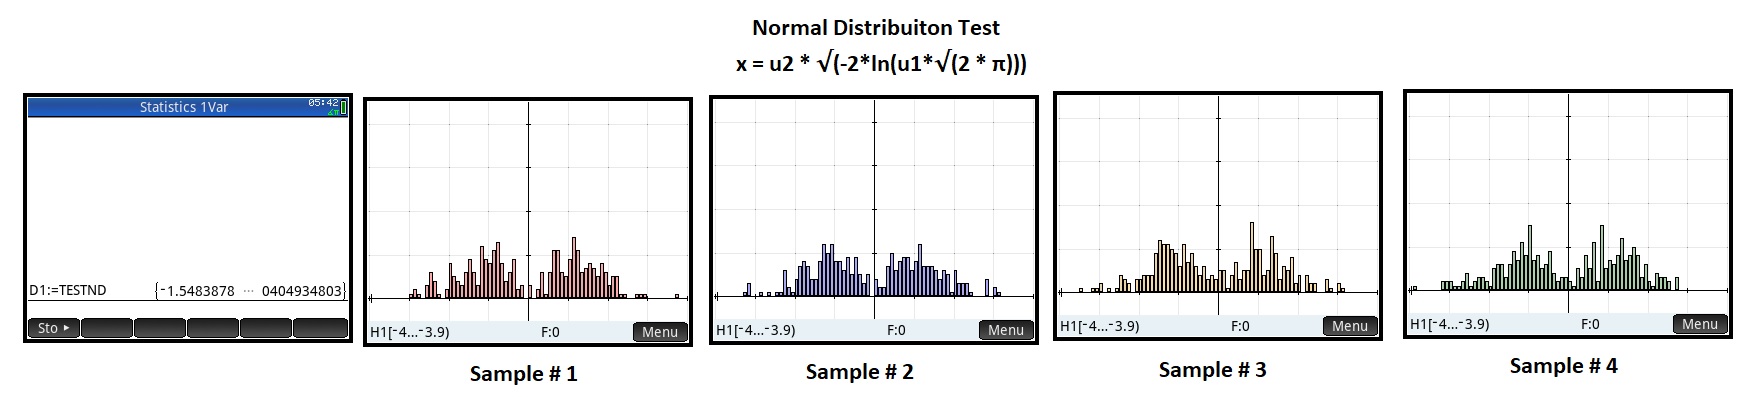
As you can see, the four samples match nowhere near a normal distribution curve. Clearly, the Box Muller transform does a better job.
Sources:
"Box-Muller transform" Wikipedia. Last edited December 27, 2020. https://en.wikipedia.org/wiki/Box%E2%80%93Muller_transform Retrieved January 20, 2021.
"Which formula does randNorm use?" Thread. The Museum of HP Calculators. Last edited October 31, 2017. https://www.hpmuseum.org/forum/thread-9403.html Retrieved January 21, 2021.
Eddie
All original content copyright, © 2011-2021. Edward Shore. Unauthorized use and/or unauthorized distribution for commercial purposes without express and written permission from the author is strictly prohibited. This blog entry may be distributed for noncommercial purposes, provided that full credit is given to the author.