Casio fx-991EX Classwiz Tips: Tables and Graphs
This week I am going to show some things that can be done with the Casio fx-991EX Classwiz.
Believe it or not, the Classwiz can produce graphs of functions. But not in the way we are used to.
Generating Tables and Graphs
To generate a table, press [ MENU ], 9: Table. The Classwiz will always ask for two functions f(x) and g(x). The function g(x) can be left blank.
You are asked for:
Start: minimum x value
End: maximum x value
Step: change of x
number of steps = ceiling((End - Start) / Step)
The maximum number of steps for f(x) alone is 45, it gets reduced to 30 if both f(x) and g(x) are used.
The table of values are displayed.
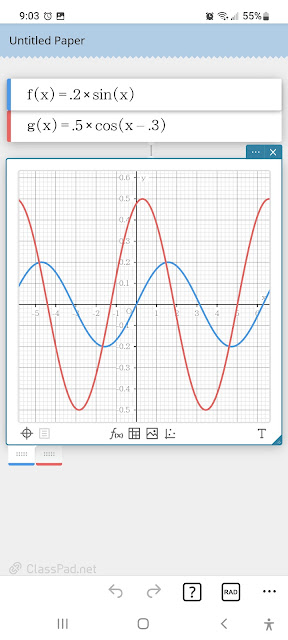
While the table is displayed, you can generate a graph by pressing [SHIFT] (QR). This has the Classwiz generating a QR code. You will need a QR reader, which you can use the Casio EDU app to read the code.
Once the QR code fits into the camera, you are given a link. Below are examples of graphs:
I hope this week has been helpful in highlighting some of the features of the Casio Classwiz. For the students in school, I wish you a happy and successful school year.
The next blog post will be on September 15, 2022. Also, I am going to talk about HHC 2022 in Nashville.
Eddie
All original content copyright, © 2011-2022. Edward Shore. Unauthorized use and/or unauthorized distribution for commercial purposes without express and written permission from the author is strictly prohibited. This blog entry may be distributed for noncommercial purposes, provided that full credit is given to the author.

